Authors: Cobaia Kitchen, with some support from Perplexity’s Deep Research and Claude 4.0 Sonnet
Images: Cobaia Kitchen
Introduction
The food system is responsible for approximately 25-30% of global greenhouse gas emissions [1], encompassing emissions from land-use change, deforestation, fertilizer use, methane from rice and cattle, farm energy use, transportation, refrigeration, food processing, packaging, cooking, and waste. Understanding the environmental impact of dietary choices has become critical for climate mitigation. At Cobaia Kitchen, we developed a comprehensive labeling system that provides users with actionable insights into the climate impact of recipes. The information the labels provide goes beyond simple carbon footprint metrics, which alone offer limited interpretability for assessing environmental impact. By contextualizing climate impact through A–E ratings and daily carbon budget allocations aligned with net-zero pathways, we enable actionable decisions without requiring numerical literacy. This system also serves as a behavioral nudge, mirroring the functionality of Nutri-Score labels.
Carbon Budget Frameworks
The concept of carbon budgets has emerged as a cornerstone of climate science and policy, providing a quantitative framework to align human activities with planetary boundaries. It originates from Earth system science that established a near-linear relationship between cumulative carbon dioxide (CO₂) emissions and global temperature rise. This proportionality, formalized as the Transient Climate Response to Cumulative Emissions (TCRE) [2], posits that each trillion tonnes of CO₂ emitted causes approximately 0.45°C of warming [3]. The Intergovernmental Panel on Climate Change (IPCC) institutionalized this concept in its Fifth Assessment Report (AR5), defining the remaining carbon budget as the maximum CO₂ emissions allowable to limit warming to a specific threshold with defined probability. The Paris Agreement (2015) prioritizes a 1.5°C threshold with 50% likelihood, chosen for its reduced risks of triggering tipping points, extreme heat events, and accelerated sea-level rise compared to 2°C scenarios. Achieving this target requires halving global emissions by 2030—an unprecedented mitigation effort. The Agreement’s “well below 2°C” threshold serves as a risk-informed upper limit balancing climate urgency with geopolitical realities.
The Global Carbon Project’s 2024 estimate of the remaining 1.5°C budget stands at 235 GtCO₂ [4]. At current emission rates exceeding 40 GtCO₂/year, this budget would be exhausted within six years. However, exceeding 1.5°C (a milestone surpassed in 2024 [5]) does not justify inaction. Every gram of CO₂ avoided and every 0.1°C of warming mitigated reduces future harm, reinforcing our motto: Now more than ever.
The concept of carbon budgets for food systems has emerged from the urgent need to align dietary patterns with the climate targets established by the Paris Agreement. Several organizations have developed frameworks to translate global climate goals into actionable metrics for food production and consumption:
EAT-Lancet Commission
The EAT-Lancet Commission established that to remain within planetary boundaries [6] while feeding a growing global population, food systems must operate within a safe operating space that encompasses both human health and environmental sustainability [7]. They propose an annual global carbon food budget of 5 GtCO₂e, aligned with Paris Agreement targets assuming full energy system decarbonization and regenerative agriculture by 2050. For a projected 2050 population of 9.7 billion, this equates to 515 kgCO₂e per person annually (1.41 kgCO₂e/person/day).
WRI Cool Food Initiative
The World Resources Institute’s Cool Food Initiative [8] targets food providers like restaurants or cantines and uses 2015 regional dietary averages as baselines rather than global budgets. The initiative targets a 38% reduction in emission intensity by 2030. For Europe, the 2015 average of 4.94 kg CO₂e/person/day necessitates a 2030 target below 3.06 kg CO₂e/person/day.
WWF One Planet Plate
The WWF One Planet Plate [9,11], aimed at restaurants and recipe creators, derives its 1.2 tCO₂e/year per capita budget from Rogelj et al. [10]. Their methodology assumes that 50% of an individual’s total carbon budget can be allocated to food consumption. With a total emissions budget of 1.2 tonnes CO₂e per capita per year to maintain a 50% probability of staying below 1.5°C warming, this translates to a daily food budget of 1.62 kgCO₂e per person per day.
Foodsteps
Foodsteps [12] provides ratings for food manufacturers and food service providers. They extend the EAT-Lancet boundary to include full lifecycle emissions, setting a 2030 “Very Low” threshold of 1.85 kgCO₂e/kg. Translated to daily budgets, this equals to 2.44 kgCO₂e/day (farm-to-fork) or 1.95 kgCO₂e/day (farm-to-gate), assuming a person eats on average 1.32kg of food per day and 20% of the emissions can be attributed to the gate-to-fork part.
RISE climate scale for meals
RISE is a Swedish research institute collaborating with industry, academia and the public sector on innovation initiatives. They developed an LCA database for food products [13] and a star-rating system for the climate impact of meals [14], that interpolates between Sweden’s 2020 average and EAT-Lancet’s 2050 target. Their 2030 target corresponds to 50% of Sweden’s 2020 average (≤0.9 kgCO₂e/meal or ≤2.57 kgCO₂e/day and person).

The Picadeli Climate Foodprint
Picadeli, a Swedish food company specializing in meals-to-go and salad bars with markets in several European countries and the US, has developed one of the most sophisticated commercial climate labeling systems currently implemented at scale [15]. It is based on EAT-Lancet, WRI Cool Food and RISE. Their methodology serves as a model for our rating system at Cobaia Kitchen. The rating is a 5-color scheme (dark green, green, yellow, orange and red) with defined threshold values that separate the colors.
System Boundary
Picadeli’s system employs a farm-to-gate approach that encompasses the entire supply chain from agricultural production through food preparation and retail distribution. The inclusion of the food preparation part (that comes before the retail sales in their case) introduces a certain difference to our system boundary [16], which excludes the cooking part. Unlike Foodsteps, they exclude the use phase part, since Picadeli’s salads and food-to-go products are usually purchased while traveling or commuting. So the portion of travel allocated to food purchase would likely be very low.
Functional Unit and Carbon Budget Allocation
Picadeli sells two different product categories: salad at self-service salad bars and ready-to-go meals like bowls or wraps. For salad bars, they use 1 kg of food as the functional unit, i.e. their footprint is in the unit kgCO₂e/kg. For ready-to-go meals, the functional unit is 1 meal, i.e. the footprint is in the unit kgCO₂e/meal.
They consider both the WRI and the RISE budget allocations with 30% and 35% respectively of the daily carbon budget to lunch or dinner. The RISE allocation includes beverages and sides, while the WRI allocation doesn’t.
Rating Thresholds
Picadeli’s target framework aims for meals with carbon footprints below 0.45 kgCO₂e, aligned with the allowable impact by 2050 defined by the EAT-Lancet Commission. Their intermediate target seeks to achieve carbon footprints 50% below the average European meal by 2030, using the WRI Cool Food European average of 4.94 kgCO₂e per person per day as baseline.
Picadeli implements a color-coded rating system with the following thresholds:
- Dark Green: <0.45 kgCO₂e per meal (corresponding to the EAT-Lancet daily budget and a budget allocation of 32% for a meal, which is in between the WRI and the RISE definitions)
- Green: <0.75 kgCO₂e per meal or <50% of the European average (2.47 kgCO₂e per day), a reduction in line with the EU commitment in the Paris Agreement and with the RISE pathway. The budget allocation is similar to the WRI allocation.
- Yellow: <1.45 kgCO₂e per meal, which is slightly lower than the European average (4.94 kgCO₂e per day) considering the WRI budget allocation.
- The Orange/Red threshold is set as 2.05 kgCO₂e per meal, dividing salad ingredients that can potentially replaced by lower-carbon ingredients and salad ingredients impossible to compensate by other ingredients.
Integration with Health Labeling
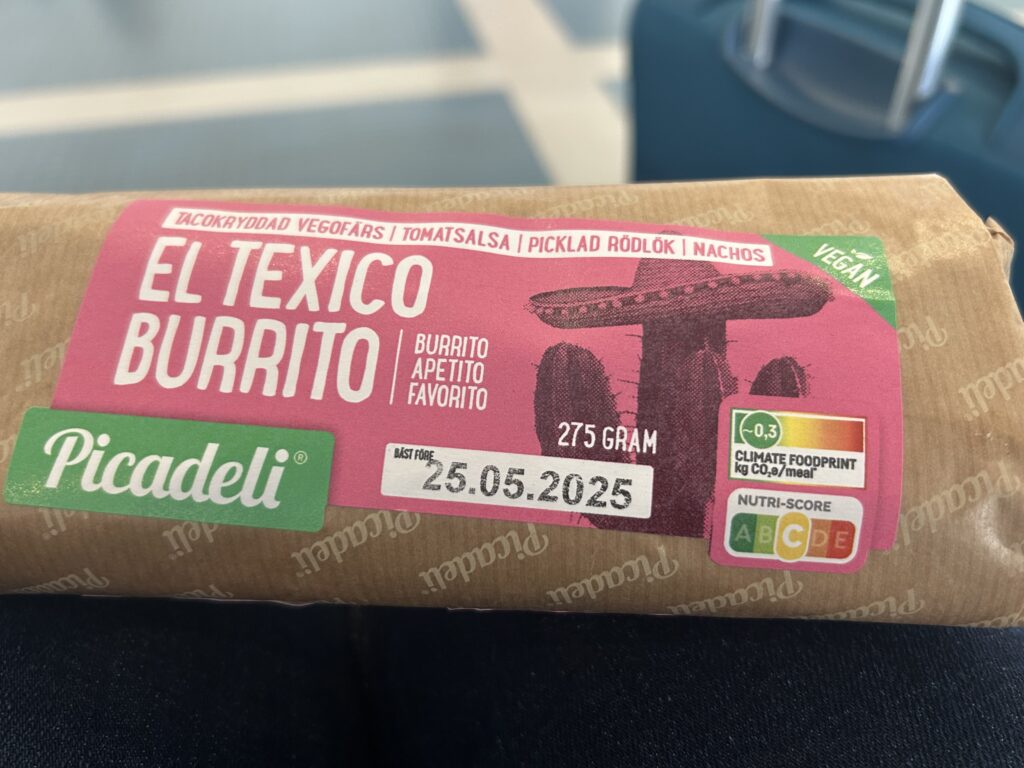
A distinguishing feature of Picadeli’s system is the parallel implementation of health labeling alongside climate metrics (Figure 2), recognizing the interconnection between planetary and human health as emphasized by the EAT-Lancet Commission.
Cobaia Kitchen’s Methodological Framework
We use the Picadeli rating system and its underlying frameworks as a model to develop our own rating system that is more tailored to our AI-generated recipes, which cover various meal types and AI portion size estimates. The Foodsteps rating system, while applying different thresholds, serves as a design model for our badge. The rating scheme of RISE, while using a methodology similar to Picadeli’s, has a much more simplistic design which feels less intuitive to understand. However, their general approach using emission reduction pathways serves as inspiration.
System Boundary
Our methodology employs a farm-to-gate approach, excluding the last-mile shop-to-home transportation and home cooking phases due to substantial regional and individual variations in travel modes, energy sources and cooking practices [16]. In addition, we include the digital footprint of recipe creation. Picadeli does not include a digital footprint (it is not relevant for them), but instead includes the cooking phase in a commercial food preparation environment. We assume that commercial food production is significantly more energy efficient than home cooking of individual meals and thus conclude that overall our system boundary is similar enough to Picadeli’s to justify using similar thresholds. Comparison with the more holistic Foodsteps approach proves difficult due to their inclusion of last-mile transportation, cooking and waste, which is why we chose to not consider the Foodsteps thresholds.
Functional Unit
A critical methodological decision involves the selection of an appropriate functional unit for comparison. Other rating systems use ‘1 kg of food’ or ‘1 meal’ as functional unit, but these did not prove practical for us. Mass-based units (kgCO₂e/kg of food) are biased against high-calorie-density foods, making e.g. look soups better than meals with a lower water content. Similarly, meal-based units (kgCO₂e/meal) proved problematic due to AI-generated portion size miscalculations, recipe types covering dinners and snacks, and considerations of individual differences in consumption patterns.
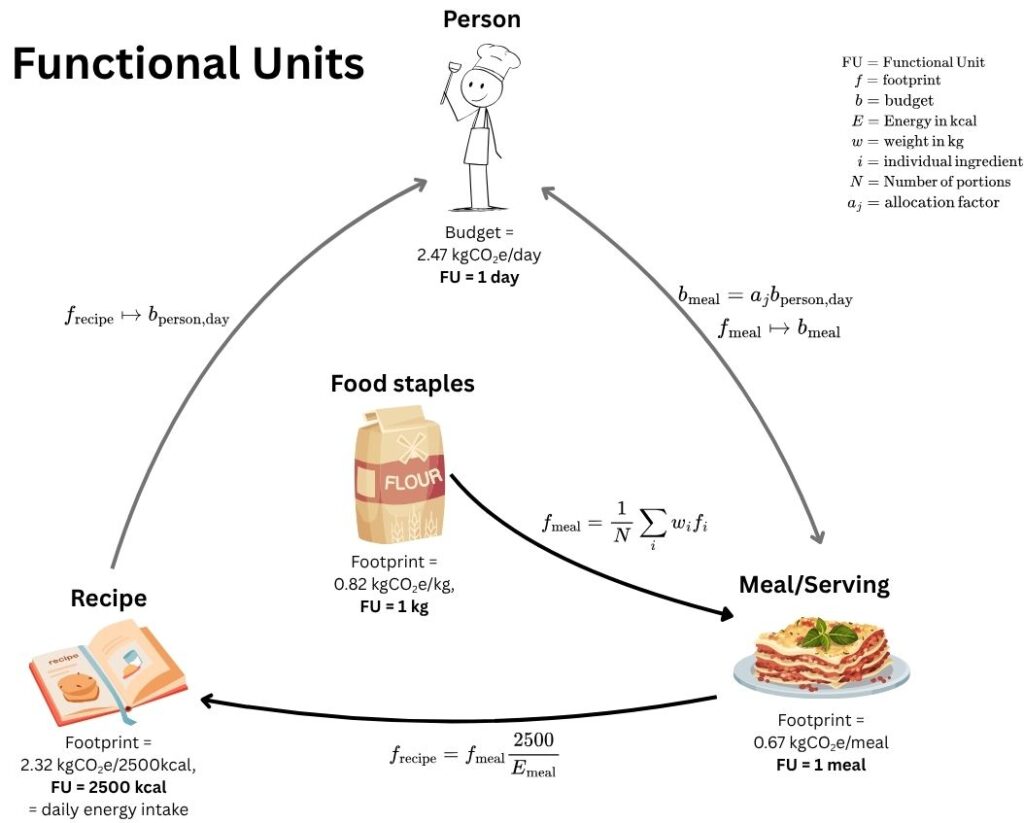
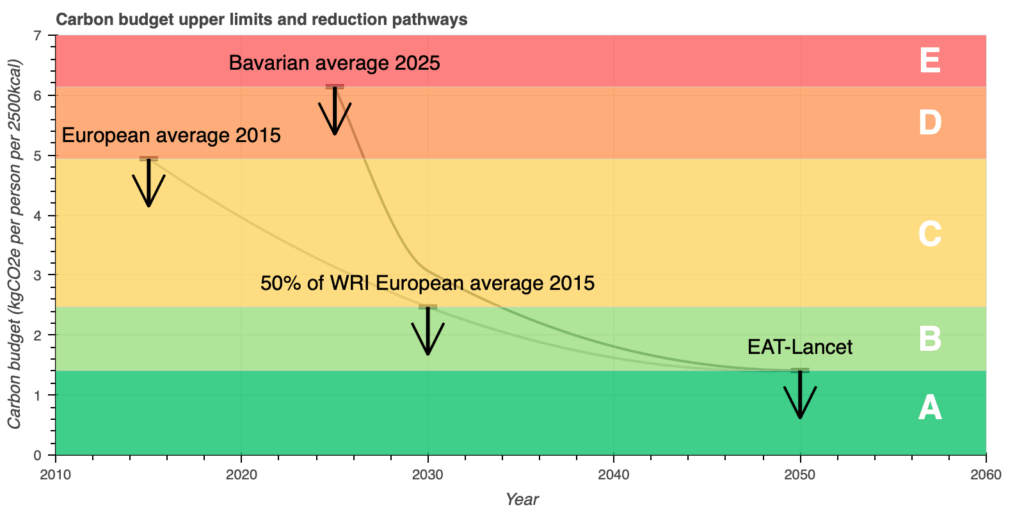
Our solution therefore employs 2500 kcal as the functional unit, assuming the average person eats 2500 kcal per day. This approach is compatible with carbon budget estimates in kgCO₂e per person per day used by several frameworks (see Figure 1) and aligns with EAT-Lancet energy intake and nutritional adequacy considerations. Figure 3 illustrates the relationships between functional units for different purposes.
Rating Thresholds
Our five-tier rating system (A through E) incorporates multiple reference frameworks:
| Rating | Threshold (kgCO₂e/2500kcal) | Scientific Basis | Color Code |
|---|---|---|---|
| A (Very Low) | ≤ 1.41 | EAT-Lancet 2050 target | Dark Green |
| B (Low) | < 2.47 | 50% of the WRI Cool Food 2015 European average | Green |
| C (Medium) | < 4.94 | WRI Cool Food 2015 European average | Yellow |
| D (High) | < 6.14 | Below Bavarian regional average | Orange |
| E (Very High) | ≥ 6.14 | Above Bavarian regional average | Red |
- As A-rating threshold (1.41 kgCO₂e/2500kcal, dark green) we use the EAT-Lancet budget as reference. It is identical to the Picadeli dark green rating, but converted to our functional unit.
- The B-rating threshold (2.47 kgCO₂e/2500kcal, green) corresponds to the ‘Green’ Picadeli 2030 interim target, representing at least 50% reduction from WRI European average emissions in 2015. While WRI aim only for a 38% reduction, 50% is in line with the EU commitment in the Paris Agreement and with the RISE pathway.
- The C-rating threshold (4.94 kgCO₂e/2500kcal, yellow) corresponds to the WRI European average daily food carbon emissions in 2015, similar to Picadeli’s “Yellow” choice. The rationale is that while the yellow range is not enough to stay in line with the Paris Agreement, it is still better than the average European meal and will contribute to an overall reduction of food emissions. We acknowledge that there are regions with higher average emissions like North America or Oceania, markets we also target with our recipes. The reason for the excessive emissions is the high meat and processed foods consumption. Since we only consider plant-based recipes with limited inclusion of processed foods, and the emission factors of plant-based ingredients in the US are not vastly different from the Agribalyse factors [19] in France (see the Carbon Cloud database [17] for comparison), a higher C-rating threshold would not be justified. We can also argue that the yellow region covers the 2030 targets (50% of the average) of high emitting regions.
- The Bavarian regional reference (6.14 kgCO₂e/2500kcal) [18] for the D-rating threshold reflects local dietary patterns with high red meat consumption, providing culturally relevant benchmarks for our German user base.
Carbon Budget Display and User Interface
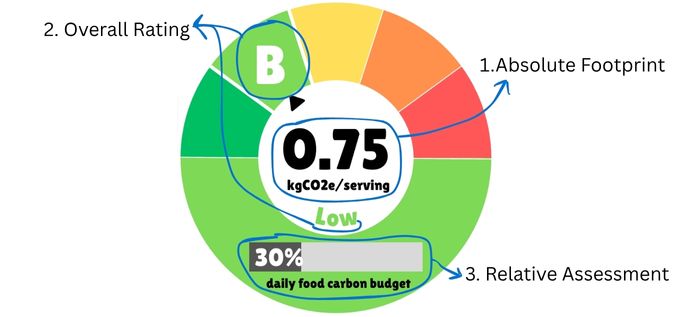
Our Climate Impact Badge presents triple information streams:
- Absolute footprint: Recipe-specific CO₂-emissions per serving. How we derive the absolute footprint is described in another blog post [16]. In our recipes, this footprint is compared to the footprint of other everyday activities.
- Overall rating (A-E): Rating derived by normalizing the absolute footprint per serving (where one serving can have an arbitrary number of kcal, depending on meal type, energy density of ingredients and AI-based estimation of the amount of food per serving) to the functional unit “2500 kcal”, i.e. the amount of energy consumed by an average active person per day. The resulting number is classified based on the scheme described in the previous section. The A-E rating is supported by a color scheme from dark green to red, for a quick visual impression of the “goodness” of the recipe. It enables cross-recipe comparison independent of portion size variations or meal categories.
- Relative assessment: Percentage of the daily carbon budget consumed with one serving of the meal. The daily budget reference uses the B-threshold (2.47 kgCO₂e) as baseline, representing the 2030 target trajectory necessary for Paris Agreement compliance. This choice reflects a pragmatic approach to system transition. While the A-threshold represents the ultimate 2050 target, achieving this level requires systemic changes in agricultural practices and energy system decarbonization, which requires coordinated policy intervention and technological development beyond individual dietary choices. By knowing the budget used by one meal, the user is able to adjust other meals during the day, thus balancing high-impact with low-impact meals.
Uncertainty and Variability
Our rating system provides guidance for making lower-carbon food choices rather than precise emission quantification.
- Carbon footprint calculations inherently involve significant uncertainty due to:
- Geographic variation: We use mainly Agribalyse [19] emission factors which are specific for France. However, production methods, energy sources and transportation distances vary globally.
- Seasonal factors: Locally produced foods consumed during their natural growing season typically have a lower carbon footprint than the same foods produced out-of-season using energy-intensive methods (such as heated greenhouses) or transported from distant regions.
- Supply chain complexity: Multi-ingredient products involve complex supply networks
- Data availability: Limited lifecycle assessment data for some ingredients
- Carbon budget estimates are based on assumptions and scenarios that may prove too optimistic given the current geopolitical situation and recent studies in climate and Earth sciences [20,21,22].
- Estimation of the energy content in kcal per serving shows some variation depending on the service used. We use the free HappyForks.com recipe analyzer, which produces results consistent with other services. However, its database does not always contain exactly the products we need, like specific sauces, ready-made products, or special grain types.
Future Developments
We continuously refine our methodology based on:
- Updated scientific research on food system emissions. In particular, we expect a major update in October 2025 from EAT-Lancet 2.0 [23].
- Expanded LCA databases with improved geographic and temporal coverage
- User feedback on rating system effectiveness
- Industry best practices from food service and retail sectors
- Greater focus on health: while trying to follow the health guidelines from EAT-Lancet overall, we are planning to include an EAT-Lancet index to quantify the healthiness and give the user a Nutri-score-like guidance in addition to the Climate Impact Badge.
Practical Applications
Recipe Development
Our climate rating system enables recipe developers to:
- Optimize ingredient selection for lower carbon impact
- Balance nutritional and environmental objectives
- Identify high-impact ingredients for potential substitutions
- Track improvement in recipe carbon performance over time
Consumer Education
The rating system provides consumers with:
- Clear visual indicators of climate impact
- Comparative information across recipe categories
- Educational context about food system emissions
- Actionable guidance for sustainable food choices
Conclusion
Our carbon budget and climate rating methodology represents a science-based approach to evaluating the environmental impact of recipes. By adapting established frameworks like Picadeli’s Climate Foodprint system and grounding our approach in peer-reviewed research, we provide a robust tool for promoting sustainable food choices.
The methodology balances scientific rigor with practical applicability, enabling meaningful comparisons while acknowledging inherent uncertainties in carbon footprint calculations. As the food system continues evolving toward sustainability, our rating system will adapt to incorporate new scientific insights and industry developments.
References
[1] Hannah Ritchie (2021) – “How much of global greenhouse gas emissions come from food?” Published online at OurWorldinData.org. Retrieved from: ‘https://ourworldindata.org/greenhouse-gas-emissions-food‘ [Online Resource]
[2] Wikipedia, Transient climate response, accessed May 26, 2025
[3] Jones, M.W., Peters, G.P., Gasser, T. et al. National contributions to climate change due to historical emissions of carbon dioxide, methane, and nitrous oxide since 1850. Sci Data10, 155 (2023). https://doi.org/10.1038/s41597-023-02041-1
[5] Zeke Hausfather, State of the climate: 2024 sets a new record as the first year above 1.5C, CarbonBrief (2025)
[6] Stockholm Resilience Center, Planetary boundaries
[7] Willett, W., et al. (2019). Food in the Anthropocene: the EAT–Lancet Commission on healthy diets from sustainable food systems. The Lancet, 393(10170), 447-492. https://www.thelancet.com/journals/lancet/article/PIIS0140-6736(18)31788-4/abstract
[8] WRI Cool Food Initiative, Identifying Cool Food Meals – 2022 Update (2022)
[9] WWF One Planet Plate: One Planet Plate – Criteria and Background (2021)
[10] Rogelj, J., den Elzen, M., Höhne, N. et al., Paris Agreement climate proposals need a boost to keep warming well below 2 °C. Nature 534, 631–639 (2016). https://doi.org/10.1038/nature18307
[12] Foodsteps, The Foodsteps’ Planetary Carbon Target: The Universal Benchmark Metric that Food Businesses Need (2023)
[13] RISE food climate database
[14] RISE Climate Scale for Meals
[15] Picadeli, Labels for a change! Labeling for the Planet – Climate Foodprint (2024)
[16] Cobaia Kitchen, Carbon footprint calculation methodology for food recipes
[18] Gimpfl, S. et al., Dietary greenhouse gas emissions and resource use among Bavarian adults: associations with sociodemographics and food choices, Frontiers in Nutrition, 12 (2025). Bavarian dietary carbon footprint analysis. https://doi.org/10.3389/fnut.2025.1542254
[19] Agribalyse Dataset: Cornelus, Mélissa; Auberger, Julie; Rimbaud, Audrey; Ceccaldi, Mathilde, 2024, “AGRIBALYSE® version 3.2”, https://doi.org/10.57745/XTENSJ, Recherche Data Gouv, V7
[20] ICOS, Finland’s forests have become a source of carbon (2025)
[21] Stefan Rahmstorf, Is the AMOC shutting down? (2024)
[22] Lee, H., Noh, KM., Oh, JH. et al. Emergence of an oceanic CO2 uptake hole under global warming. Nat Commun 16, 3199 (2025). https://doi.org/10.1038/s41467-025-57724-7
[23] EAT-Lancet 2.0
Accessibility Statement
We recognize that our color-coded climate assessment system may present challenges for individuals with color blindness, particularly those with red-green color vision deficiencies. Our decision to use the traditional traffic light color scheme (red, yellow, green) aligns with established industry standards commonly employed in climate labeling and Nutri-Score systems, ensuring consistency and familiarity for most users.
The green color in our system serves a dual purpose: it universally represents “good” or positive outcomes, while also symbolizing environmental friendliness and sustainability. Conversely, red typically signifies areas of concern or negative environmental impact. This color convention helps create an intuitive understanding of our climate assessments at a glance.
To enhance accessibility for people with color blindness, we have incorporated A-E letter grades alongside our color coding. These clear alphabetical labels ensure that all users, regardless of color vision abilities, can easily interpret and understand our climate assessment ratings. This dual-coding approach maintains visual clarity while making our content accessible to everyone.
We remain committed to improving accessibility and welcome feedback on how we can better serve all members of our community.